[ About Us | Popular | Marcom | AdNet | IChannel | Glossary ]
Showing posts with label statistics. Show all posts

Mar 30, 2009

STATS IAB Reports Internet Advertising Grew 10 Percent Last Year; Outpacing TV

by Erick Schonfeld on March 30, 2009
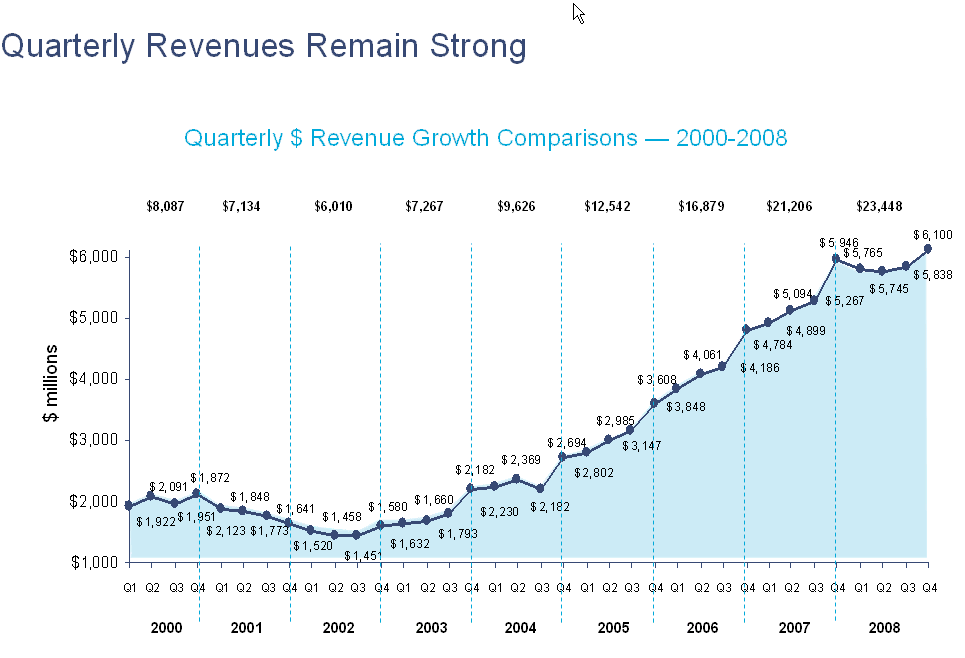
In an upbeat report this morning, the Interactive Advertising Bureau reported that internet advertising in the U.S. grew 10.6 percent to $23.4 billion. And the $6.1 billion fourth quarter (up 2.6 percent) was the first time Internet advertising surpassed the $6 billion mark. That said, the rate of growth declined both on an annual and quarterly basis. Even the 4.5 percent sequential growth over the third quarter was the lowest since 2002 (as was the annual growth rate).

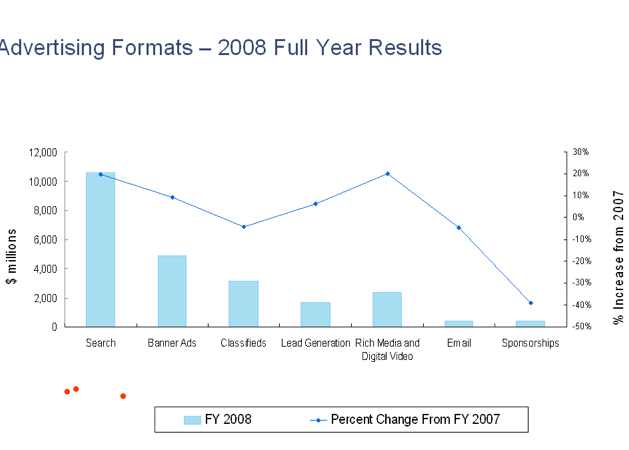
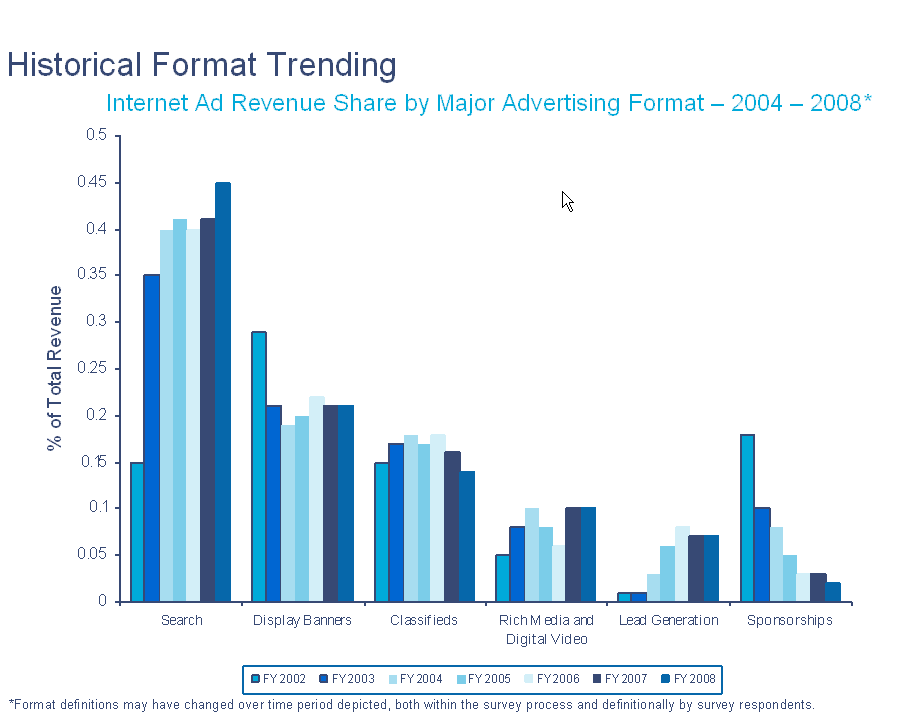
Search advertising dominated, with 46 percent of total Internet advertising market share. It also grew more than 20 percent for the year. The only category which grew as fast was rich media and video. Online video advertising grew faster than any other sub-category, with 123 percent annual growth (going from $324 million in 2007 to $724 million in 2008). Display advertising was able to eke out 8 percent growth for the year, but declined 4 percent in the fourth quarter.
iab-2008-ad-caegories

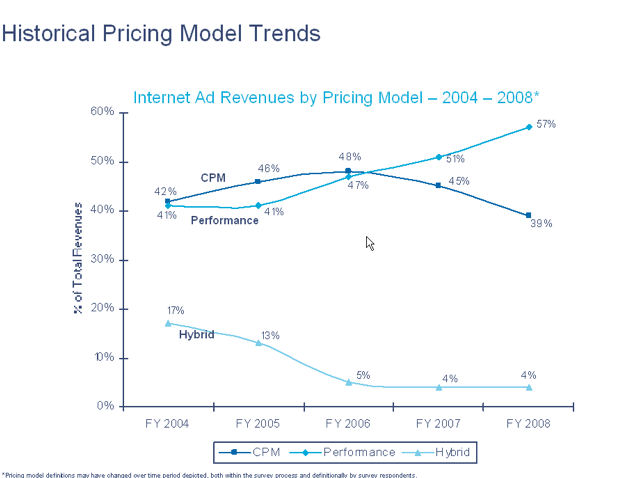
Performance-based advertising widened the gap over plain-vanilla impression-based advertising (CPM) last year, with 57 percent of all internet advertising revenues being performance-based versus 39 percent being CPM-based. That 18 percent gap widened from a 6 percent gap last year.
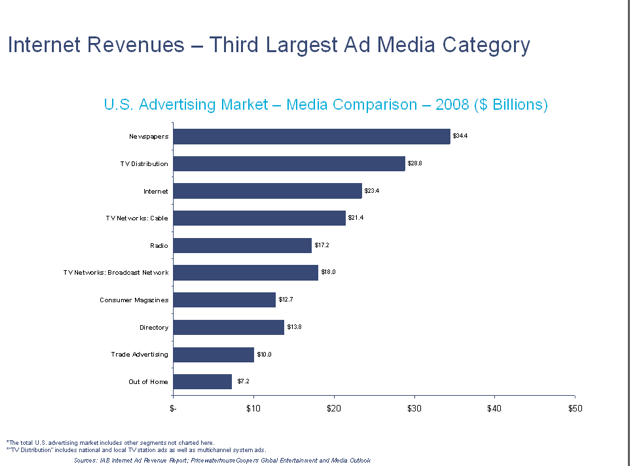
The IAB also trotted out some numbers showing that Internet advertising revenues are outpacing TV advertising by some measures. The $23.4 billion in annual internet advertising spending exceeded advertising on cable TV for the first time (which was $21.4 billion), and took the No. 3 spot behind national and local TV ads ($29.8 billion) and newspaper ads ($34.4 billion).
And in a new analysis comparing the first 14 years of Internet advertising revenues to the the first 14 years of cable and broadcast TV advertising, the IAB found that Internet advertising surpassed cable TV advertising in Year 4 ($907 million versus $499 million) and broadcast TV advertising in Year 10 ($9.6 billion versus $8.9 billion). Now, in Year 14, Internet advertising is almost twice as large as broadcast TV advertising was in its 14th year ($13.3 billion) and nearly four times as large as cable TV ($6.5 billion).

14year-comparisn-internet-vs-tv

Mar 10, 2009

Are Blogs Losing Their Authority To The Statusphere?

Ed: @Amit. @Brian. agreed. Technorati’s authority is questionable.

comShare, Nielsen, Quantcast, google analytics, hitwise, and weblogs are also under fire. MIT Technology Review just updated the status.

What may be relevant is that

1. The web is morphing faster than anyone pundit can comprehend. Think blind men and the elephant. The Software Platforms supersite crowd-sources and tracks over 200 platforms like Google Apps, AJAXAPI, MapAPI, etc. That’s probably 10% of the available platforms on the web.

2. User attention is shifting fast. One report shows that social networks, with all its variations like Facebook, Twitter, FriendFeed, disqus, etc has passed email for user time and frequency.

3. Analytics quickly lose relevance. If you can’t see the whole, how can you program the algorythms to track what’s relevant?

4. Without relevant data, how do pundits forecast the future?

Intuition rules in this state of chaos. But with millions forecasting the future state of the web, the chances for anyone to be right declines.

As a past econometrician, we had a saying. If you don’t know the answer, forecast often. If you’re right, tell the world. If you’re wrong, forecast again.

The report on the data is useful. Hope that Brian is not forecasting like past econometricians.


Are Blogs Losing Their Authority To The Statusphere?
by Brian Solis on March 10, 2009

Depending on which numbers you source or believe, all reports agree that the blogosphere continues to expand globally.

As the leading blog directory and search engine, Technorati maintains a coveted Authority Index which is considered amongst bloggers as the benchmark for measuring their rank and selling their position within the blogosphere. (At least until recently). Authority in the index is defined as the number of blogs linking to a website within the last six months. The higher the number, the greater the level of Authority a blog earns.

However, a disruptive trend is already at play. While blogs are increasing in quantity, their authority–as currently measured by Technorati–is collectively losing influence. For instance, just last November, Technorati counted 32,493 links towards gadget blog Engadget’s “authority.” Today, it counts half that amount (16,326). Even TechCrunch’s link authority as measured by Technorati is down by several thousand links, yet its relative position in the overall ranking (No. 3) hasn’t moved.

In its annual state of the blogosphere last year, Technorati revealed that it had indexed 133 million blog records since 2002. In March 2008, Universal McCann published a report that indicated 184 million blogs worldwide were created, with 346 million people reading blogs globally.

Blogging is entrenched in the mainstream. Indeed, consumers, businesses, content publishers, and media channels are embracing blogs as a way of engaging existing and reaching new readers to build an ecosystem around relevant conversations. It’s the convergence of dialog and journalism, creating a new generation of interconnectedness between publisher and community.

So why do I believe that blog authority is losing its authority?

Feb 5, 2009

STATS Is The Worst Behind Us? Online Ad Revenues Pick Up In The Fourth Quarter.

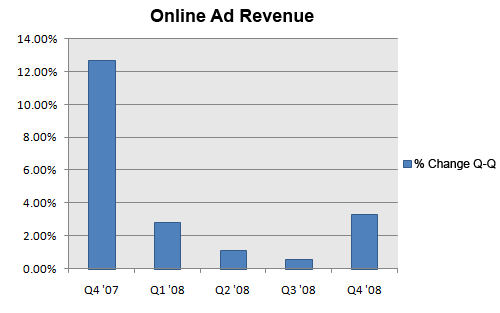
With Time Warner reporting earnings yesterday, we now have online advertising numbers for the fourth quarter from the four largest players: Google, Yahoo, Microsoft, and AOL. Tallying up their online advertising revenues provides a decent proxy for the health of the overall online advertising industry as a whole, since they represent a majority of those revenues. (For comparison, see IAB numbers for the U.S. only).  After a full year of slowing growth, their combined ad revenues actually picked up in the fourth quarter, showing a 3 percent rise compared to the third quarter. Combined revenues grew 8 percent on an annual basis.

Like everyone else, I’ve been expecting to see continuing pressure on Internet advertising. In the third quarter, the sequential growth of the combined ad revenues from these four companies ground to a halt, going from 12.7 percent sequential growth in the fourth quarter of 2007 to 0.6 percent in the third.  (All growth rates are quarter over quarter, unless otherwise noted).

What the slight rebound in growth tells us is that search advertising may be making up for the continued weakness in display advertising, which each of these companies acknowledged in their conference calls.  The question is whether sequential growth will remain in this low range for the rest of the year, or whether search advertising can push it higher. One quarter’s worth of data is not enough to make any conclusons on that front, but at least these numbers provide a ray of hope.

The combined ad revenues totaled $8.5 billion in the fourth quarter, up from $8.2 billion in the third quarter and $7.8 billion in the fourth quarter of 2007. Google continued to dominate, accounting for 65 percent of those revenues, up from 61 percent from a year ago but slightly down from its 65.3 percent share in the third quarter.  Google contributed slightly more than half of the growth.  Yahoo’s 19.1 percent share of revenues went up quarter-over-quarter by the same amount that Google’s went down (0.3 percent).  Microsoft’s $866 million in online revenues gave it a 10.2 share, up from 9.4 percent in the third quarter.  And AOL’s advertising revenues remained flat at $507 million, giving it a 6.0 percent share (down 0.2 percent).

For the purposes of this analysis, I took the total advertising revenues from both Google and Yahoo, including their network revenues paid to affiliates, the online revenues reported by Microsoft, and only the advertising portion of AOL’s revenues. The revenue share figures above are rounded. Below are the absolute revenue numbers, broken down by company:

Jan 29, 2009

STATS Online Newspaper Visits Increase 27%

nielsen-online-newspaper-websites-top-10-unique-visitors-december-2008.jpg


The top 10 newspapers in the US collectively saw a 16% year-over-year increase in unique visitors to their websites in 2008, as well as a 27% increase in the total number of overall visits, according to data from Nielsen Online.

The number of unique visitors grew from 34.6 million unique visitors in December 2007 to 40.1 million in December 2008.

NYTimes.com was the #1 online newspaper destination in December 2008, with 18.2 million unique visitors. USATODAY.com and washingtonpost.com took the #2 and #3 spots, with 11.4 million and 9.5 million unique visitors, respectively, Nielsen Online reported.

The New York Daily News online edition experienced the highest growth in unique visitors (99%), while Boston.com was the only online newspaper to experience a decline (-6%).

“Nine of the top 10 newspaper Web sites experienced positive year-over-year growth,” said Chuck Schilling, research director, agency & media, Nielsen Online. “News coverage in December ranged from how the 2008 holiday season would be affected by the weakening economy to Obama’s latest nomination for his administration, all of which helped to drive this impressive growth.”

Online Newspaper Readers Visiting More Frequently

In addition to an increased number of unique visitors to newspaper sites, readers also are frequenting these these web destinations more often than they were a year ago. The number of total visits to the top 10 newspaper sites increased 27% year-over-year, growing from 199.6 million in December 2007 to 252.7 million in December 2008.

nielsen-online-newspaper-websites-total-sessions-visits-december-2008.jpg

“Despite the current troubles for the traditional newspaper industry, people are visiting newspaper sites more and more often to stay on top of current events,” said Schilling. “The challenge for newspaper publishers today is to learn how to capitalize on this active online readership and translate their increasing engagement into revenue.”

Jan 23, 2009

STAT ComScore: Internet Population Passes One Billion; Top 15 Countries

Ed: Web is still hyper-growth business. Mobile and netbooks add to easy access.

The number of people on the Internet surpassed one billion in December, according to comScore. The actual number is probably higher than that (Internet World Stats counted nearly 1.5 billion Web surfers worldwide as of June 30, 2008). In any case, only between 15 and 22 percent of the world’s population is on the Internet. We have a long way to go.

Using the comScore numbers, here is the breakdown by country and region (in unique visitors as of December, 2008; some of the numbers are rounded):


Top 15 countries, by Internet population:

  1. China: 179.7 million
  2. United States: 163.3 million
  3. Japan: 60.0 million
  4. Germany: 37.0 million
  5. United Kingdom: 36.7 million
  6. France: 34.0 million
  7. India: 32.1 million
  8. Russia: 29.0 million
  9. Brazil: 27.7 million
  10. South Korea: 27.3 million
  11. Canada: 21.8 million
  12. Italy: 20.8 million
  13. Spain: 17.9 million
  14. Mexico: 12.5 million
  15. Netherlands: 11.8 million

Worldwide Internet Audience

  • Asia Pacific: 416 million (41.3%)
  • Europe: 283 million (28.0%)
  • North America: 185 million (18.4%)
  • Latin America: 75 million (7.4%)
  • Middle East & Africa: 49 million (4.8%)

Dec 8, 2008

Holiday E-Commerce Season Sales Finally Match Last Year as Two Workdays this Past Week Each Surpass $800 Million in Online Spending

Sales Since Cyber Monday Up 9 Percent Versus Year Ago


RESTON, VA, December 7, 2008 – comScore (NASDAQ : SCOR), a leader in measuring the digital world, today reported its tracking of holiday season retail e-commerce spending for the first 35 days of the November – December 2008 holiday season. For the holiday season through December 5, $14.92 billion has been spent online, essentially the same level compared to the corresponding days last year. For the five days beginning with December 1 (Cyber Monday), the kick-off to the heaviest part of the online shopping season, sales totaled $3.74 billion, up 9 percent versus year ago. Two individual days in the past week achieved more than $800 million in online spending: Monday, December 1 (“Cyber Monday”) with $846 million, and Tuesday, December 2 with $823 million.


2008 Holiday Season To Date vs. Corresponding Days* in 2007

Non-Travel (Retail) Spending

Excludes Auctions and Large Corporate Purchases

Total U.S. – Home/Work/University Locations

Source: comScore, Inc.


Holiday Season to Date

Millions ($)

2007

2008

Pct Change

November 1 – December 5

$14,903

$14,922

0%

Dec .1 (Cyber Monday) – Dec. 5

$3,419

$3,743

9%

*Corresponding days based on equivalent shopping days relative to Thanksgiving (October 27 – November 30, 2007)


“The online holiday shopping season has picked up noticeably since Thanksgiving as consumers have given in to the holiday spirit – and very attractive retailer discounts,” said comScore chairman Gian Fulgoni. “Particularly encouraging is the growth of 9 percent in online sales that has occurred since Cyber Monday. While this growth is certainly a positive development in this tough retail season, it also needs to be put into perspective. With the compressed time period between Thanksgiving and Christmas this year – five days shorter than last year – we need to see continued strong growth during the critical weeks between today and Christmas if this year’s shopping season is to at least match that of last year.”


Top Performing Retail Categories Since Cyber Monday

The fastest growing product categories during the period from December 1 through December 5 were Sport & Fitness (up 35 percent) and Consumer Electronics (up 24 percent), which saw sales surge as a result of significant price reductions on many items, including flat panel TVs. Apparel & Accessories, the second largest retail category in terms of dollar sales (after Computer Hardware) during this period, also experienced strong gains (up 16 percent). The softest retail categories include Music, Movies & Videos (down 24 percent) and Jewelry & Watches (down 22 percent).


Growth in Retail E-Commerce Categories by Dollar Sales Since Cyber Monday

Non-Travel (Retail) Spending

Excludes Auctions and Large Corporate Purchases

Dec. 1- Dec. 5, 2008 vs. Corresponding Shopping Days in 2007

Total U.S. – Home/Work/University Locations

Source: comScore, Inc.

Retail Category

Y/Y Percent Change in Category Sales ($)

Sport & Fitness

35%

Consumer Electronics

24%

Apparel & Accessories

16%

Toys

16%

Books & Magazines

10%

Video Games, Consoles & Accessories

9%

Computer Hardware

2%

Home, Garden & Furniture

0%

Flowers, Greetings & Gifts

-8%

Jewelry & Watches

-22%

Music, Movies & Videos

-24%


Visitors to Top Retailer Sites Since Cyber Monday

During the five-day period since Cyber Monday, traffic to the retail site category is up 2 percent versus year ago, with many sites drawing a substantial number of visitors. eBay topped the list with 36 million unique visitors, while three of the top ten retailer sites saw gains versus year ago: Amazon Sites (up 10 percent), Wal-Mart (up 7 percent), and Apple Inc. (up 29 percent).


Visitor Growth at Top Retailer Sites

Dec. 1- Dec. 5, 2008 vs. Corresponding Shopping Days in 2007

Total U.S. – Home/Work/University Locations

Source: comScore, Inc.


Unique Visitors (000)

2007

2008

Percent Change

Retail Site Category

118,393

121,271

2%

eBay

40,180

36,631

-9%

Amazon Sites

26,859

29,505

10%

Wal-Mart

18,183

19,514

7%

Target Corporation

16,273

15,905

-2%

Apple Inc.

9,290

11,943

29%

Best Buy Sites

9,350

8,561

-8%

JCPenney Sites

6,657

6,435

-3%

Overstock.com

6,930

5,874

-15%

Toysrus Sites

6,434

5,969

-7%

Dell

6,740

5,611

-17%


comScore’s Summary of  2008 Holiday Online Retail Spending by Key Time Period

Online Non-Travel (Retail) Holiday Consumer Spending

Excludes Auctions and Large Corporate Purchases

Total U.S. – Home/Work/University Locations

Source: comScore, Inc.


Millions ($)

2007

2008

Pct Change

January – October

$93,551

$102,144

9%

comScore Holiday Season Forecast (Nov-Dec)

$29,169

$29,200**

0%**

November 27 (Thanksgiving Day)*

$273

$288

6%

November 28 (Black Friday)*

$531

$534

1%

December 1 (Cyber Monday)*

$733

$846

15%

* Versus Corresponding Shopping Day in 2007 Relative to Thanksgiving

**Forecast


About comScore

comScore, Inc. (NASDAQ: SCOR) is a global leader in measuring the digital world and preferred source of digital marketing intelligence. For more information, please visit www.comscore.com/boilerplate.

Race is on for hot holiday products

Every holiday season we comb through our search data to find the season’s most popular products. Some are recurring favorites – like Ugg boots (much to my chagrin) and the Wii, but to help mix up the wish lists some new entrants swing through each year and for 2008 it isBakugan. These popular toys are based upon a Japanese anime television series Bakugan Battle Brawlers, using metal cards and round, magnetic miniature figures that spring open to fight. Over the past 5 weeks, searches on ‘bakugan’ have been driving increased traffic to the Shopping & Classifieds category as holiday buyers seek out the much-desired toy.

bakugan searches.png

Scarcity seems to make the heart grow fonder, so the demand for hot products always translates into searches to locate any retailers that may have the product in stock. The Wii game console has been the holiday challenge over the past few seasons and now the Wii Fit game has also become a hot commodity, with both appearing among the top 10 ‘in-stock’ searches.

In-stock searches.png

Variations of the Bakugan toys have also started appear in the ‘in stock’ searches, so we may see them follow the path of the Wii (although no Bakugan Finder websites just yet). Now is a good time for retailers with inventory of Bakugan toys to exploit their availability & capture sales. Don't worry, if your feet are cold, Ugg boots are still in-demand, with plenty of supply.


Support Our Sponsors: